
Better insights to better serve your ministry
Giving analytics dashboard for Rock RMS
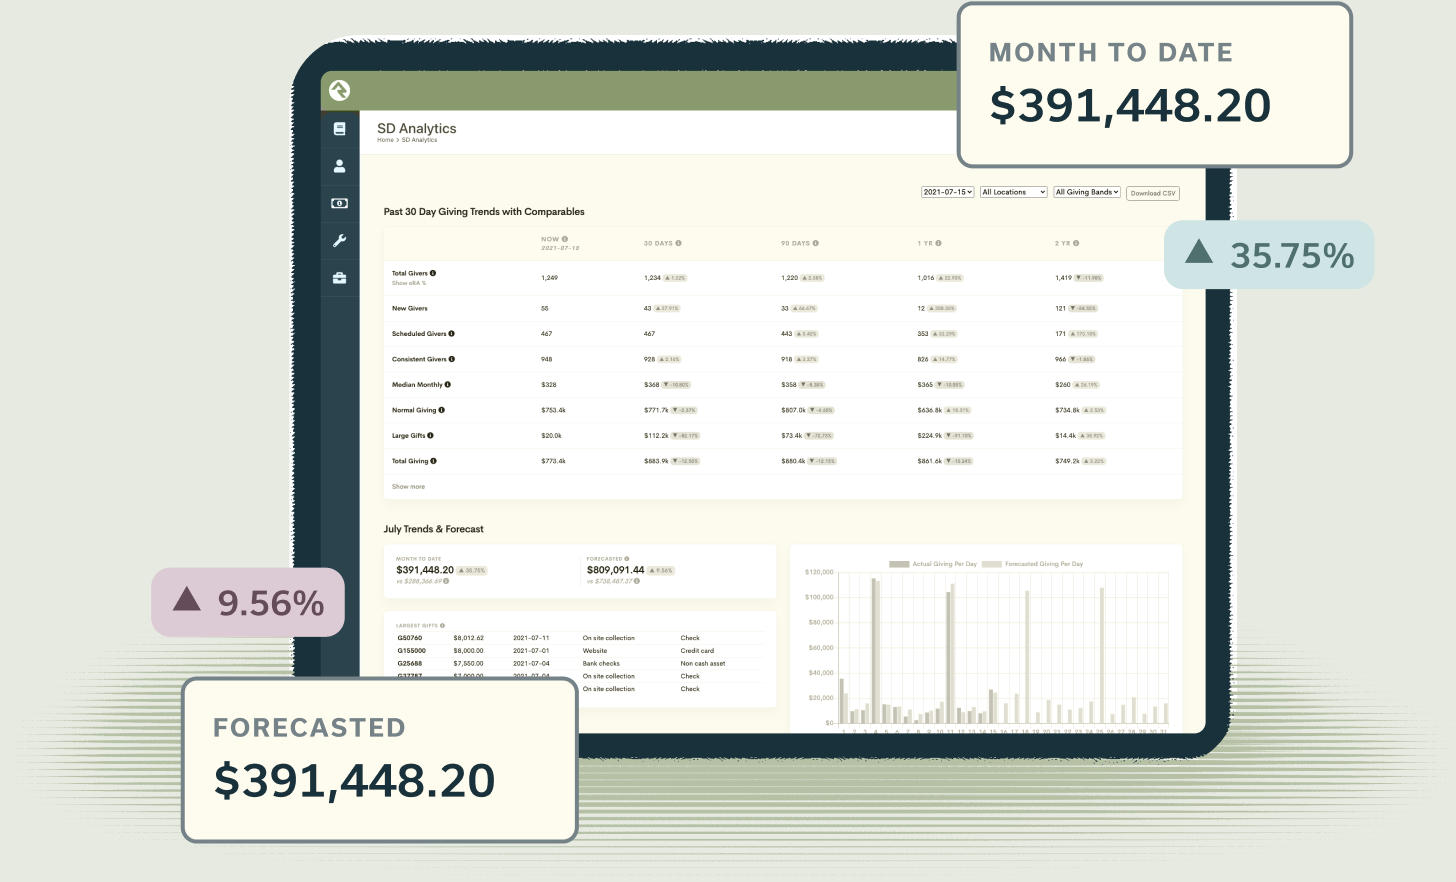
Get to know your ministry a little better with Simple’s giving analytics dashboard. Gain valuable insights into how your congregation gives, from individual donors to overall trends, with everything accessible in Rock.

Understand your givers
Identify givers by how many times they've given, how often they give, and much more.
Notice trends
View short- and long-term trends and forecast future giving.
Make better decisions
Use your insights to make more informed decisions for your church.

Case studies
See how Merlin helped other churches
See how Merlin helped other churches
Bayside Church
Bayside Church simplified their online giving and raised nearly $1 million in one day.
Merlin giving made conference donations quick and easy
Read more
Crossings Community Church
If you're going to operate within Rock, I don't know why you would go with anyone else instead of Simple.
Smooth migration to a better giving experience
Read more